Many users have not fully embraced the new Google Analytics 4 (GA4) layout, even though it is frequently updated with new features. Due to privacy concerns with Google’s Universal Analytics (UA) that have become widespread and Google’s announcement to switch off UA, now seems like a good time to use GA4.
A landing page is a website that is created to generate leads for a specific good or service. A valuable tool for evaluating the usefulness of your landing pages is the Google Analytics 4 Landing Page Report. In digital marketing, landing pages are a crucial idea to increase traffic to your website and maximize the effectiveness of your marketing efforts. It’s critical to understand how and where visitors enter. It’s reasonable to state that your sales process heavily depends on the lead generation landing pages.
Then again, what are landing pages? And how can companies use software like Google Analytics to learn how visitors arrive at their website? Fill out the form and form field monitoring landing pages in Google Analytics. You can optimize the right pages and improve your SEO and paid advertising campaigns. The importance of landing pages for optimizing a marketing campaign cannot be emphasized because they are the entry point for visitors to your site. We will demonstrate in this guide how to create a Google Analytics 4 Landing Page Report in about 4 minutes. So let’s get started.
GA4: What Is It?
We previously opened Behavior reports > Site Content > Landing Pages in Universal Analytics (UA). We were given acquisition, Behavior, and conversion metrics sorted by the landing page visitors used to access the location in the UA landing pages report. You might become more granular by including segments, extra dimensions, and sophisticated filters. This information is essential for guiding content strategy, setting priorities for optimal page optimization, and fine-tuning conversion rate optimization initiatives. A landing page report is not available in Google Analytics 4 (GA4), but it is possible and can be created by following the instructions in this text.
The latest version of Google Analytics, known as GA4, offers a more privacy-focused method for tracking users across websites and mobile app while using fewer first-party cookies to comply with evolving privacy regulations. The highly advanced machine learning algorithms in Google Analytics 4 notify webmasters of major data trends, such as rising demand for a product or service. CTA buttons on your website, it’s likely that you already realize how crucial it is to track your conversions.
Google has improved its machine learning capabilities to “fill in the gaps” when users decide not to accept cookies. This has allowed GA4 to continue offering insights on user engagement while maintaining the anonymity of their users’ data and collects lead.
What is a landing page for Google Analytics?

You can use your current Google email addresses and password for tracking and reporting purposes or create a brand-new one. The first page users see when entering your website is called the “landing page” in Google Analytics. This page is your landing page on our website. For instance, if you found the item, you’re reading on Google and clicked on it there.
No matter where a user clicks—from Google search results, an email link, a link on another website, social media, or anywhere else—a landing page is the first page they encounter.
Tracking and storing potential customer data is a crucial problem, so Google Analytics 4 also includes essential considerations in this area. With GA4, you’ll be able to control more effectively how you gather and utilize Analytics data and when you use data to optimize advertisements.
Exactly what is a Landing Pages Report?
The list of all your website’s landing pages with the most traffic may be seen in the Google Analytics Landing Pages report. The first page a user views during a session is what Google Analytics refers to as a landing page. Your website’s entrance. The information is arranged according to the total number of visitors who came to your pages during a particular time frame. To access this report, sign into your Google Analytics account, choose the right property, and view, then select Behavior from the menu on the left, followed by Site Content > Landing Pages.
Since it displays crucial information like sessions, bounce rates, pages per session, and more, this report is beneficial for search engine marketing. Since both SEO and search engine PPC rely on tracking landing pages in Google Analytics to understand performance, it may be used for both types of marketing. You get a graph that displays your overall traffic for a chosen period in addition to this data broken down by specific pages. You can also use other segments or filters to hone in on the information that matters to you.
You can access other information like transactions, revenue, and conversion rate if you have set up eCommerce Tracking. Goals can be established, and the Landing Pages Report allows you to monitor their progress. eCommerce data in Google Analytics enables marketers to more detailed reports and information across various reports.
Why is the report on landing pages significant?
The Landing Pages Report is crucial because it enables you to identify the pages on your website that receive the most visitors. In Google Analytics, the first ten or so landing pages presented are your top landing pages; these are the sites that serve as the introduction to your website. However, this report may display up to 5000 URLs at once and can provide data for all landing pages.
Your company can get the answers to many questions concerning the effectiveness of your website using the information in the Landing Pages Report. Paying close attention to this part is essential for your SEM efforts because landing pages are the first dealings a visitor has with your website. They represent the points of entry to your website and point to pages with excellent inbound marketing potential.
You may use these pages to drive even more traffic to your website if you can optimise them for inbound marketing.
The Landing Pages Report can provide you with information on how effectively your marketing is working, the user’s interests, how they found your site (SERPs, social media, internet ads, etc.), and their activity.
What are the Methods for utilizing the Landing Pages report
When monitoring landing pages in Google Analytics, you have a variety of segment and filter options to narrow in on specific data.
Employing Segments
Your Analytics data is divided up into segments. They are simply filters you can employ without changing the underlying data. You can filter your statistics using default segments, including organic, paid, and referral traffic, and choices for custom segmentation.
You can view the data separately using default segmentation for organic and paid traffic and have active paid and organic campaigns. You may track the development of each advertising campaign separately by creating segments for them and high converting landing page.
You could use the default segmentation for those data sets to compare desktop traffic and mobile traffic separately if you want to. If you see desktop traffic doing substantially better, your mobile usability may need some improvement. Whichever part you choose to use or build can be highly instructive to the health and functionality of your site. You have many possibilities for combining various attributes to create multiple segments. Utilize this information to plan your marketing campaigns and upgrade your website strategically.
Secondary Dimensions
Data’s descriptive properties or characteristics are referred to as dimensions. You may compare data based on various factors, including source, campaign, device category, etc. These valuable tools can be used to compare multiple data and are not specific to the Landing Pages report.
To deconstruct your data in the Landing Pages Report, you can set these extra dimensions further. You may learn how users are discovering your landing pages, for instance, by adding a source/medium dimension.
Filters
All you have to do, according to your URL structure, is utilize the search box to filter data by specific terms or phrases in the page URLs. For instance, you can type “/blog” and select Search to see only the landing pages for your blog. Similar applies to the “/products” and “/categories” sites. You can add dimensions or metrics and other filter data sets using the advanced filtering option.
You can delve deeper into information using the Advanced Filters, available to the right of the search bar. The data can be filtered to include or exclude specific words or phrases, and additional dimensions or metrics can be added.
Key Metrics
We’ll concentrate on a few crucial metrics that can provide you with a wealth of information about your pages from the many default metrics and data you can check when examining your top landing pages in Google Analytics.
The first category is sessions, which refers to a user’s time actively using your website over a predetermined period. Because there is a chance for a new session to begin when an existing one finishes, users can start numerous sessions simultaneously over days, weeks, or months.
Sessions can reflect several page views and sometimes even multiple admissions if a user leaves and returns to your website. Sessions are practical the entire time a user is on your site.
Sessions stop due to time or a change in the campaign. Sessions typically end at midnight or after 30 minutes of inactivity. The previous session will stop, and a new one will start if a user enters through one campaign, uses it to depart, and then uses it to return. Depending on how long users typically need to spend on your site, you may modify the extinction time from 30 minutes to a more reasonable period.
Many different things may occur during these sessions and are noted by Google Analytics. This data can be compared to find trends or variations in the number of sessions, which makes this information crucial. You can analyze sources to determine which brings in the most visitors, how many pages each source produces per session, and other information.
The New Users metric is the next. The quantity of brand-new site visitors over a given period is the number of new users. This is crucial to pay attention to increase your website’s traffic.
This indicator allows you to assess how successful your user acquisition efforts were based on your marketing strategies. A high number of new users who interact with your website is beneficial, but a low number who interact and convert isn’t always negative either. There are additional indicators to pay close attention to that will tell you how important these users are, even though having such a high number of new users could seem like a good thing. Bounce rate and conversions are two examples.
- Bounce rate – The proportion of single-page sessions in which there was no engagement with the page is known as the bounce rate in Google Analytics. Essentially, it indicates that a user clicked on your link but quickly left the page after failing to see what they were looking for. Even though you might be accessing more and more new users each month, if they aren’t converting or connecting with your website, they aren’t getting what they’re looking for. This could be related to new users.
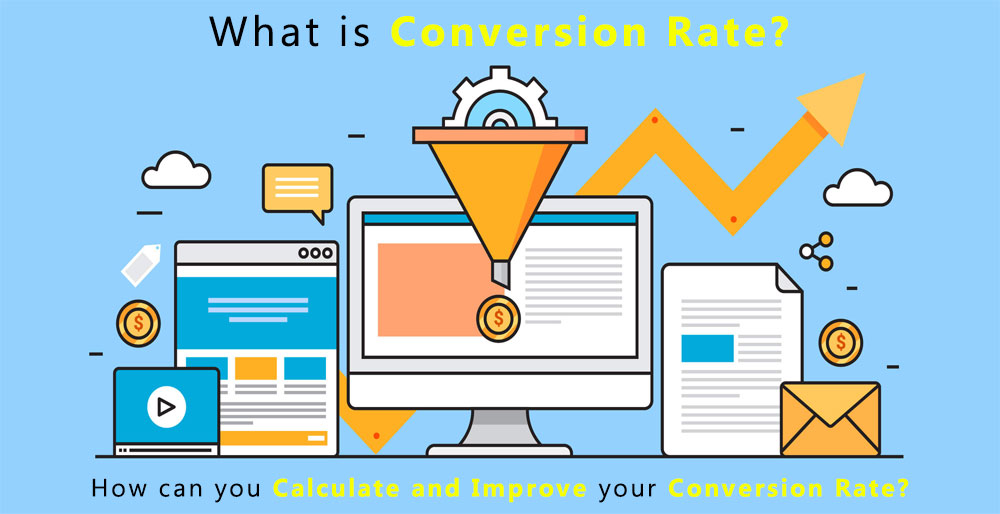
- Conversion rate: You may check information like revenue and increases conversions rate if you’ve set up eCommerce Tracking. Discussing conversion rate is vital since, as I said before, a high user count combined with poor conversion rates may indicate that certain pages still need work. Depending on each site’s selected KPIs, the sheer volume of conversions may be more valuable for some.
What are the Comparing landing pages from various periods?
Additionally, Google Analytics offers period modifications for your top landing sites. It can be helpful to resemble the facts you’ve discovered with several dates to get more insight.
For instance, you may track the development of a campaign over various time frames or years by simply altering the dates. You can set custom dates or compare data with the prior period. There are alternatives for previous-year, prior-period, and customized time frame comparisons.
If you’ve noticed a drop in traffic to your landing pages, comparing two data sets will help you determine which sites have lost the most visitors. You may devise a new plan to optimize these pages with this knowledge. Marketers can assess long-term performance using time comparisons.
Comparing Google Analytics data from your top landing pages is a great approach to gauge success. You may determine whether or not your marketing campaign impacts more individuals by keeping track of the date your campaign started and comparing it with more recent data.
How do you start optimizing these sites, though?

Optimizing your sites for on-page SEO elements like meta data and content is the best place to start. Focus on the kinds of words or phrases that users will use to locate you when you begin to research new keywords for your meta title. Users might be unable to identify you if your title tags are overly ambiguous, which is likely a significant factor.
Your optimized content marketing approach comes last.
Write some content for your pages first if you don’t already have any! The more details you can give the user about your goods or services, the more likely they will buy. Include any information you may have that you believe will influence the user’s decision to buy your product. Once this material is on the page, you can round it out with a few of your title tag keywords to boost keyword density. Be careful not to overuse keywords.
You ought to check your keyword list as you work to optimize your paid advertisements. It would be best to continually modify and improve your keyword research strategy to consider shifting search trends. After you’ve optimized them, if your chosen keywords have a low CTR, remove them and start over.
After you’ve completed all of this, track your top lead capture pages in Google Analytics to see how your website has fared. Then restart everything! Using the Landing Pages Report will significantly benefit your search engine marketing activities. It enables you to monitor the advancement of your campaign over time. It can assist you in determining which pages require optimization so that you know where to concentrate your efforts.
The Wrapping up
When monitoring the types of landing pages in Google Analytics, there is a lot you can discover about your website and optimization efforts, so invest the time to explore and comprehend user activity on your landing pages. Get in touch with iMetaDex to learn more about search results and SEO tools that will push your website to the top of the search results
To learn more about iMetaDex™, click here.
MetaSense Marketing Management Inc.
866-875-META (6382)
support@metasensemarketing.com

